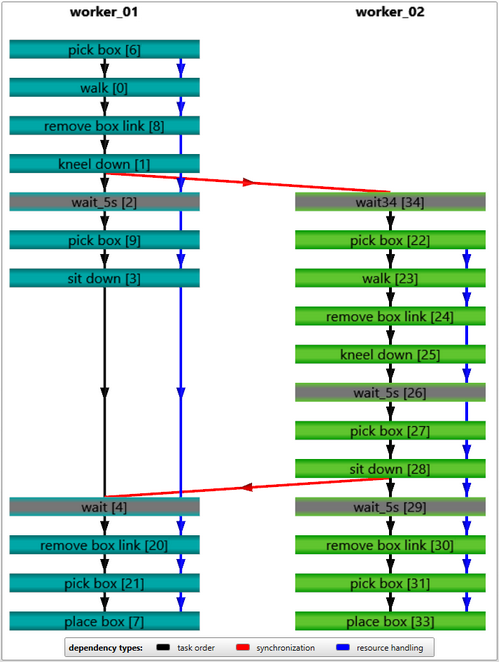
The chart depicts the worker(s)/ "Dynamic object(s)" and the associated tasks using appropriate color code. The relationship between the tasks are described using 3 different dependency types:
▪Task order (black) - Sequence of performance according to the time line
▪Synchronization ( red) - Dependency between the tasks during time synchronization. For e.g., one task waits for the completion of the other task
▪Resource handling (blue) - Dependency between the tasks while using the same resources (for e.g. when a tool is used several times or several tasks use the same tool)

Figure 124: Description of the evaluation-area-chart
![]() Default Zoom - Output is shown back in the default zoom by clicking this button
Default Zoom - Output is shown back in the default zoom by clicking this button
The control of the evaluation area view is similar to the 2D spaghetti chart (see chapter User interface / Tab "Results" / Spaghetti chart / Evaluation area).