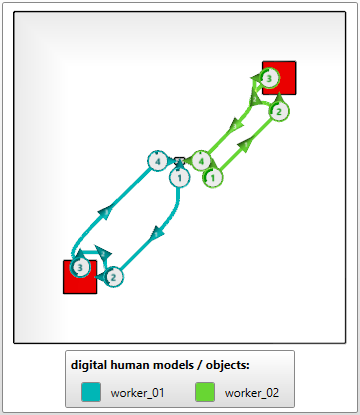
The evaluation area (see figure Evaluation area - spaghetti chart) represents all relevant paths, work
positions and their chronological sequence in the form of a diagram.
The generated graphic indicates the current scenario (3D layout) in top view. Here, all objects visible in
the 3D layout are represented in simplified form with their bounding boxes. Furthermore, all work
positions adopted during simulation and their generated paths are mapped.

Figure 119: Evaluation area - spaghetti chart
The view of the evaluation area is controlled via the mouse. The following functions are provided for that
purpose:
Function |
Left mouse button |
Middle mouse button |
Right mouse button |
|---|---|---|---|
Shift spaghetti chart (horizontally, vertically) |
Keep pressed & move the mouse |
|
|
Enlarge / minimise spaghetti chart |
|
Keep pressed & move the mouse |
|
Rotate spaghetti chart (only 3D mode) |
|
|
Keep pressed & move the mouse |
![]() By pressing the button Default zoom, the initial view is restored.
By pressing the button Default zoom, the initial view is restored.
![]() If the 2D button (Switch to 3D mode) is active, the spaghetti diagram is represented in 2D mode (top view) (see figure Evaluation area - spaghetti chart)
If the 2D button (Switch to 3D mode) is active, the spaghetti diagram is represented in 2D mode (top view) (see figure Evaluation area - spaghetti chart)
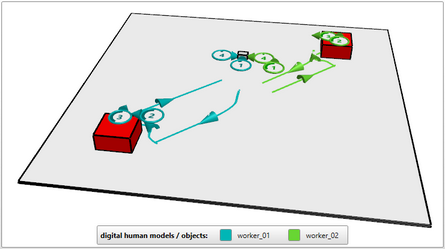
![]() If the 3D button (Switch to 2D mode) is active, the spaghetti diagram is displayed in 3D mode (see figure 3D mode)
If the 3D button (Switch to 2D mode) is active, the spaghetti diagram is displayed in 3D mode (see figure 3D mode)
![]() With the button Enable arrow/flow visualization in 3D view, the paths in the Spaghetti chart are shown in the 3D view as well.
With the button Enable arrow/flow visualization in 3D view, the paths in the Spaghetti chart are shown in the 3D view as well.
![]() With the button disable arrow/flow visualization in 3D view, the paths in the Spaghetti chart which are shown in the 3D view are removed.
With the button disable arrow/flow visualization in 3D view, the paths in the Spaghetti chart which are shown in the 3D view are removed.

Figure 120: 3D mode
The following symbols are used for representation in the spaghetti diagram:
|
Object |
Marking of objects (red for collision objects, grey for normal objects, semi-transparent grey for floor objects)
|
|
Work position |
The direction of the arrow defines the direction of the view at the work position. The number refers to the Work position number. The incircle radius refers to the percentage of the overall dwell time. |
|
Path |
The direction of the arrow defines the motion direction. The number refers to the path number (see table Paths). |
The work position radius, the length of the path arrow and the line width of the path can be individually
adjusted (see chapter User interface / Menu bar / Options / Reporting / Export).
The Default / minimal work position radius (spaghetti chart) [mm] indicates its reach (standard: 250 mm).
The Path arrow length (spaghetti chart) [mm] indicates the length of the path arrow (standard: 200 mm). For very short paths, the arrow length is automatically adjusted. In case of short paths, the arrow is shortened correspondingly.
The Path thickness (spaghetti chart) [px] indicates the width of the path in pixels (standard: 4 px).
The value of the Position merge radius [mm] which can be set for the report parameters is used
to group work positions which are located closely to each other in order to maintain clarity. In doing so,
the durations of the individual work positions are added and the performed tasks are summarised under
the grouped work positions.
Example without position summary |
Example with position summary |
|
|
|
|
Figure 121: Without merged work positions, all work positions and paths are visible |
Figure 122: With merged work positions, work positions and paths are partially visible |