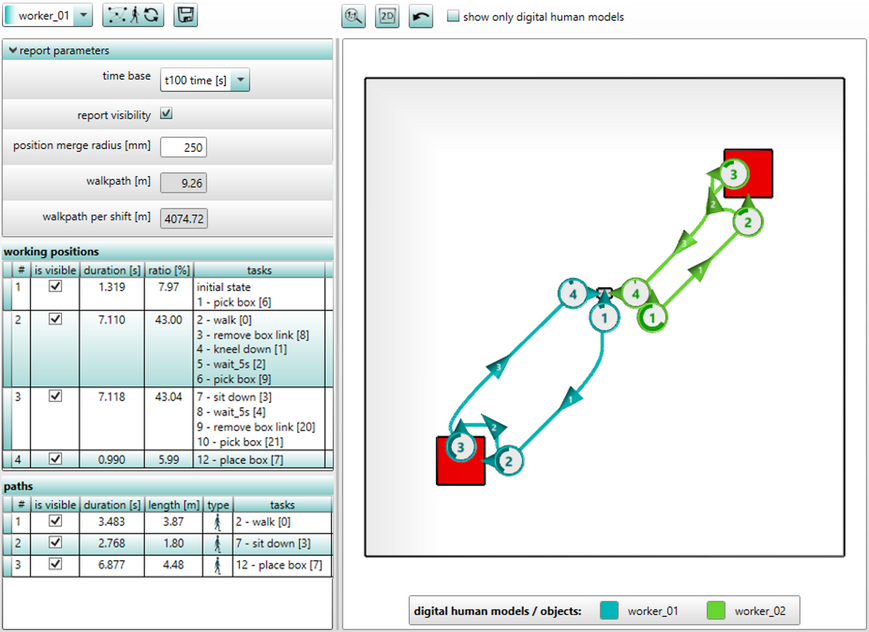
It is not sufficient to only capture the relevant information. It is also important to make it available to the user in an easily comprehensible form. The ema spaghetti diagram documents the complex 3D processes in a intelligible way (see figure Spaghetti chart).
Using the sequence of actions already entered in ema, other useful information can be calculated and displayed. Every path and work position, labelled in chronological order, is presented using a Spaghetti chart. A Spaghetti chart is generated for each worker in a simulation.
As usual, the report can be configured via parameters and adjusted to personal needs. In doing so, the visibility of each elements can be individually changed. The work positions can also be bracketed within some random limits. For that purpose, a parameter representing the range of variation of the work position need to be specified.
The generated information can be exported as well. The PNG format for video display and the XLSX and CSV format for the structured output of text data are available as export formats. As a matter of course, the new functionality integrates into the ema workflow and thus the updation of results in case of changes in the underlying simulation will happen automatically.

Figure 117: Spaghetti chart
1 The upper left part of the work area of the Spaghetti chart includes several command buttons (see chapter User interface / tab "Results" / Spaghetti diagram / Buttons).
2 The area where the parameters for the generation of the report are displayed and configured (see chapter User interface / tab "Results" / Spaghetti diagram / Input area).
3 In the right area, the results are displayed in the form of a spaghetti diagram (see chapter User interface / tab "Results" / Spaghetti diagram / Evaluation area).