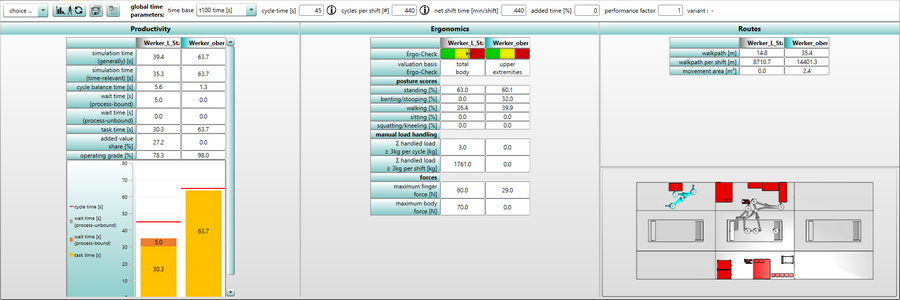
The general objectives of the result cockpit are:
▪see at firs glance whether the simulation is as desired or not
▪jump-off point to go to detailed results
▪comparison of several workers
▪view is license independent
The result cockpit (see figure Result cockpit) consists of buttons, an input area and three modules: Productivity, Ergonomics and Routes.

Figure 79: Result cockpit
![]() Various information related to worker(s) can be obtained by selecting the worker(s) from the Drop-Down-List (top left).
Various information related to worker(s) can be obtained by selecting the worker(s) from the Drop-Down-List (top left).
![]() As with the ergonomic calculation, the basic requirement for the presentation of results is a successful simulation run. The values of the result tables can be updated at any time using the update / recheck button.
As with the ergonomic calculation, the basic requirement for the presentation of results is a successful simulation run. The values of the result tables can be updated at any time using the update / recheck button.
![]() When the calculation of the result cockpit data is successfully completed, the values can be exported in the form of a table in Microsoft® Excel format. By clicking the Export results cockpit ... button, the collective report export dialog is opened (see chapter User interface / Tab "results").
When the calculation of the result cockpit data is successfully completed, the values can be exported in the form of a table in Microsoft® Excel format. By clicking the Export results cockpit ... button, the collective report export dialog is opened (see chapter User interface / Tab "results").
When exporting the ergonomics data, two file formats are available:
▪Text file (separated by separators) (.csv) (*.csv)
▪Excel 2007 file (.xlsx) (*.xlsx)
![]() The worker settings button opens a window in which different time parameters can be set individually. There are also input areas for global time parameters, which can also be set in the simulation project tab (see chapter User interface / Tab "simulation project"). A
The worker settings button opens a window in which different time parameters can be set individually. There are also input areas for global time parameters, which can also be set in the simulation project tab (see chapter User interface / Tab "simulation project"). A ![]() behind the respective area indicates deviation(s). By mouse-over over the symbol you can find out how many human models deviate from the global parameter.
behind the respective area indicates deviation(s). By mouse-over over the symbol you can find out how many human models deviate from the global parameter.
The active variant is displayed at the top right.
iA correct display of results requires a successful simulation run! |
Below the buttons and the input area are the three modules: Productivity, Ergonomics and Routes.
iIf the mouse becomes a hand symbol, an action can be done. When you click on the line description, you will be redirected to the respective sub-tab. When you click on the worker´s result, you are redirected to the respective sub-tab with the preselected worker (who was clicked on). iThe redirection to the ergonomics sub-tab is license dependent! |
The Productivity module is shown on the left. The forwarding leads to the cycle time chart (see chapter User interface / Tab "Results" / Cycle time chart).
The simulation time (generally) corresponds to the sum of task time and wait time. The simulation time (time-relevant) results from the simulation time (generally) reduced by the non-time-relevant tasks.
Cycle balance time is the difference between cycle time and the simulation time (time-relevant).
The wait time (process-bound) is the sum of all wait tasks times of a behavior with the active parameter "process-bound". Therefore the wait time (process-unbound) is this but with deactivated parameter.
The task time results from the simulation time (time-relevant) minus the wait time.
The added value share indicates the share of productive tasks.
The operating grade indicates the share of the simulation time (time-relevant) in the cycle time.
This overview is complemented by a diagram representing the times of each worker.
The Ergonomics module is in the middle. The forwarding leads to the ergonomics (see chapter User interface / Tab "Results" / Ergonomics).
In this module, the physical strain at this workplace is displayed. The first line shows the Ergo-Check display in the form of a bar (on the arrow line) the ergonomics classification calculated for the simulation (based on the EAWS method). The valuation basis for the ergo check is the higher value. This makes it clear at first glance whether the “total body” or the “upper extremities” are rated higher.
The sum of postures (except bending/stooping) is always ≤ 100%.
On the right is the Routes module. The forwarding from the selected worker leads to the Spaghetti chart of this worker (see chapter User interface / Tab "Results" / Spaghetti chart).
The automatic zoom shows all selected human models.