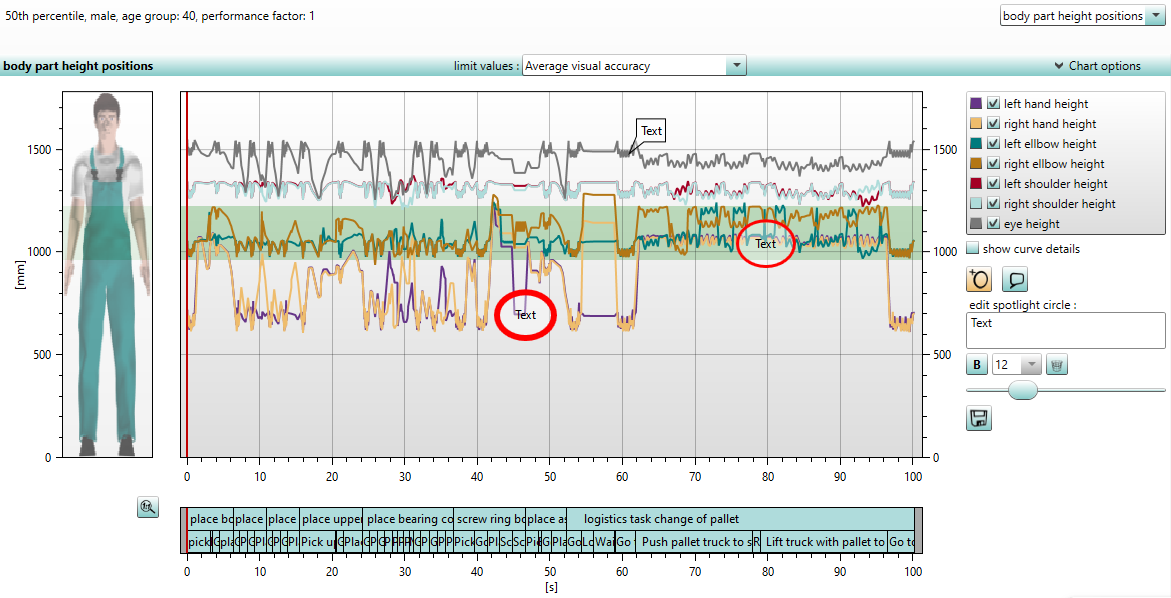
The evaluation for the Body part height positions (figure Body part height positions) shows the height of relevant body parts in millimetres in the simulation sequence. The height is relative to the average foot height of both feet. The left and right hand, the left and right elbow, the left and right shoulder as well as the eye height are considered in each posture. The corresponding points and lines of the height indications are represented in the diagram if the respective checkbox is activated. Each colored point represents the body part height (Y-axis) at a specific time along a normalized time frame (X-axis). For example, the point in time and duration of overhead work can be easily determined from the diagram (hand height above the eye level). In the event that the eye level curve and the shoulder level curve are at the same height, this could indicate an extremely bent posture.

Figure 90: Body part height positions
On the left hand side, there is an image of the human model and, if set, a visualization of the limit values in relation to the body size and visual requirements of the work activity. These color-coded limit values can be activated in the upper selection field limit values for the working height according to standard values (DIN EN ISO 14738:2009) or according to individually set values (see chapter User interface / Menu bar / Options / Settings / Charts).
In the chart options there is an option to add spotlight circles and text boxes, whose size and text details can be adjusted. Above these buttons is the checkbox show curve details. Is it activated, detailed information is displayed when moving the red time slider. It shifts with the time line of the simulation. In the task bar shown below the chart, you can jump directly to the time of a task. The red time slider shows the current position.
For the chart and the task bar zooming with the mouse wheel, shifting with the right mouse button and displaying detailed information with the left mouse button are possible. The button ![]() resets to default zoom.
resets to default zoom.
The chart can be exported as a .png file via the button ![]() .
.