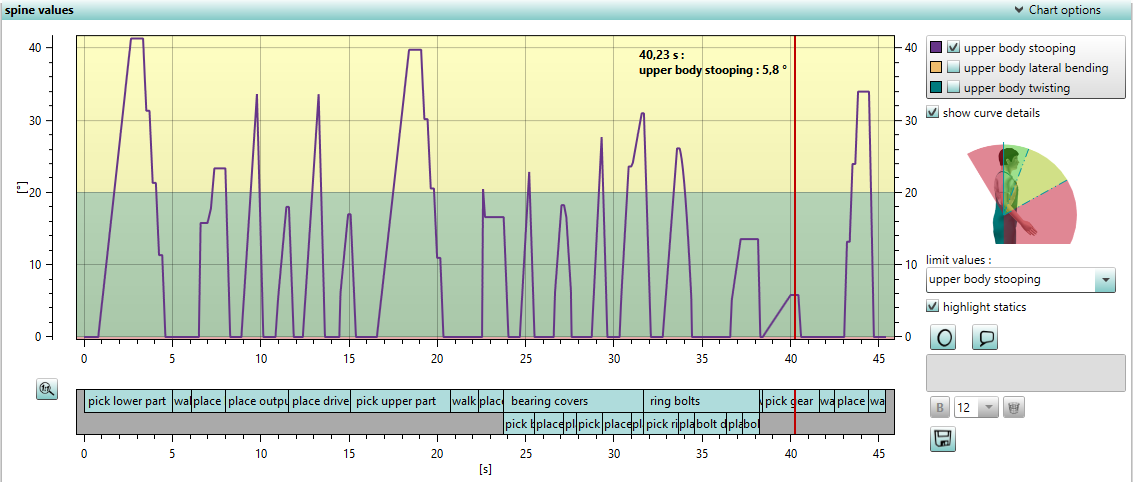
As the name suggests, the diagram Spine values (figure Spine values) indicates the angle of the twisting and bending of the lumbar spine and thoracic spine in degrees [°]. Each point in the diagram represents a point in time (horizontal axis) when a posture was created and the corresponding bending or twisting angle of the spine area considered (vertical axis).

Figure 91: Spine values
In the chart options the visualization of the upper body stooping, lateral bending, or twisting can be (de)activated. In the drop down menu limit values, one of the three movements can be selected which is then shown in the chart colorized according to the limit values of the body angles according to DIN EN 1005-4:2005 or individually set values (see chapter User interface / Menu bar / Options / Settings / Charts).
The checkbox highlight statics marks the areas in which the body posture is static (+/- 1,5° for at least 4 s according to DIN EN 1005-1, 2001) and shows the duration.
The other chart options are described in User interface / Sub tab "Ergonomics" / Body part height positions.
Furthermore, the limit values of the body angles can be shown as coloring of the upper body of the human model in the simulation (see chapter User interface / 3D settings / Documentation).