The data from ema Plant Designer can be imported into ema Work Designer. The data import is initiated over the toolbar in emaPD. When it is activated there, the project is transferred into emaWD. In the toolbar you can then see the name of the used PD project with the project id, result id and amount of yearly discs in parenthesis as well as the name of the saved WD project (*.ema file) (see figure Interface toolbar).

Figure 208: Interface toolbar
The functions supported by emaPD interface could be found in the sub-menu ema Plant Designer defined in the menu Im-/Export. The menu item Import from ema Plant Designer XML file ... is used to import an XML file exported from the ema Plant Designer.
iWhen importing, all data available in the simulation will remain unchanged (tasks, objects etc...). |
After importing the file, the following information are available in the simulation:
▪Label of the work place / machine
▪Work place area: grey area is the size of the base area of the work place
▪Machine area: size of the white bounding box corresponds to the base area of the machine
▪Buffer place: the intensity of the color of the container corresponds to its usage. Darker the color higher the usage.
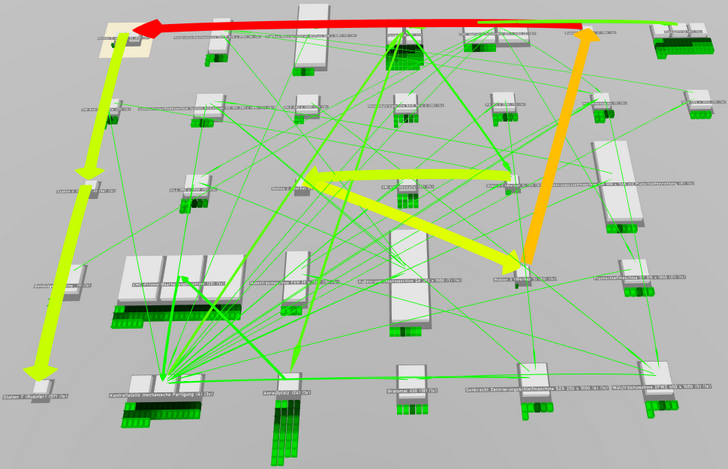
▪Transport effort: Colored arrows (green corresponds to lower transport effort, red corresponds to higher transport effort)
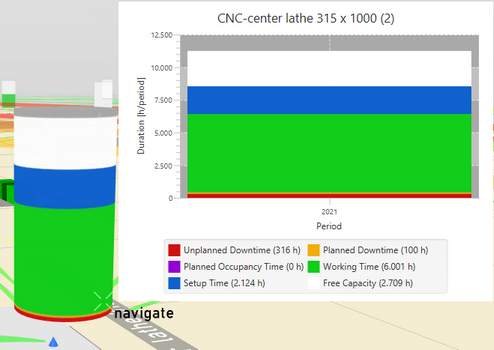
▪Workload indicator and chart for the workplaces (see figure Workload indicator and chart).

Figure 209: Workload indicator and chart
Additionally it opens the window layout data (see figure layout data - initial import). This window displays the production area and the transport effort. When the data is imported from the file, the work places are automatically arranged in a grid (see figure Automatic grid arrangement - Initialimport). Via the button ![]() in the window layout data the resources can be arranged automatically based on the modified triangle method according to Schmigalla. This forms a good starting position for the planner.
in the window layout data the resources can be arranged automatically based on the modified triangle method according to Schmigalla. This forms a good starting position for the planner.
The modified triangle method according to Schmigalla places the resources on a triangular grid based on their material flow relations. The order of arrangement and the locations are determined separately from each other. Step by step the next element is selected which has the highest material flow relation to the resources that have already been placed. It is positioned where the additional transport effort is minimal. Due to its good results, the method is often described in specialist literature and used in the planning of operational structures.
Resources / stations can be locked ![]() in the object tree (see chapter User interface / Tab "Objects" / Tree view). Through this fixation, these stations retain their coordinates. The determination of the arrangement order and placement of the other stations is based on the fixed stations.
in the object tree (see chapter User interface / Tab "Objects" / Tree view). Through this fixation, these stations retain their coordinates. The determination of the arrangement order and placement of the other stations is based on the fixed stations.
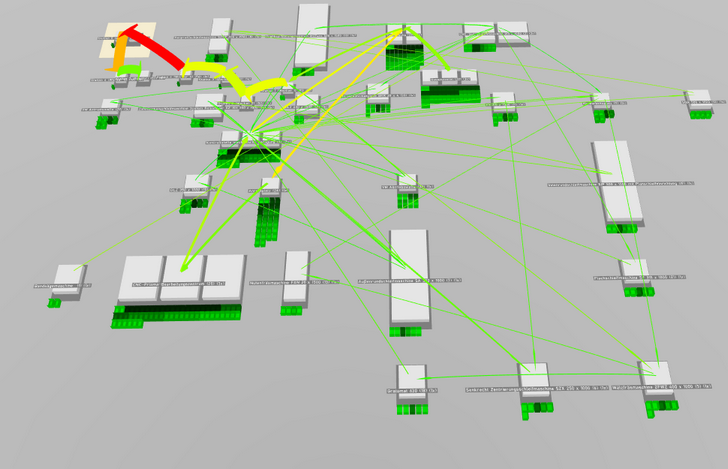
While manually changing the position of the work place, the length and color of the associated transport effort arrow will also change (see figure Automatic grid arrangement - Manual position alterations). In the layout data window, the bar shows how much the transport effort has changed with the change in the position of the work places (better transport effort: green bar, negative percentage, see figure layout data - after manual shift or worse transport effort: red bar, positive percentage). Using this information the layout could be manually optimized.
By clicking the button ![]() , the current transport effort replaces the original transport effort and the bar is also reset.
, the current transport effort replaces the original transport effort and the bar is also reset.
|
|
Figure 210: layout data - initial import |
Figure 211: layout data - after manual shift |

Figure 212: Automatic grid arrangement - Initial import

Figure 213: Automatic grid arrangement - Manual position alterations
The layout data window could be closed either by clicking on ![]() or clicking the sub-menu item hide layout data defined in the sub-menu ema Plant Designer which is defined in the menu Im-\Export. When this window is closed, the arrows (transport effort) will also become invisible. This window could be opened again by clicking the sub-menu item show layout data and this automatically makes the transport effort arrows visible.
or clicking the sub-menu item hide layout data defined in the sub-menu ema Plant Designer which is defined in the menu Im-\Export. When this window is closed, the arrows (transport effort) will also become invisible. This window could be opened again by clicking the sub-menu item show layout data and this automatically makes the transport effort arrows visible.
Via the item ema Plant Designer in the menu bar path maps can be imported and exported (as *.emaPathmap files) as well as deleted. More information to the path map editor can be found in the chapter User interface / 3D settings / Interaction modes / Path map editor.
With the interface toolbar adapted projects can be send back from the Work Designer to the Plant Designer. This is done by clicking the button ![]() send data to emaPD .... In the case of inconsistencies, for example because tasks were moved without adjusting the operation ids, a dialog opens up to eliminate those inconsistencies marked in purple. The transfer back to the PD cannot take place until all inconsistencies have been removed.
send data to emaPD .... In the case of inconsistencies, for example because tasks were moved without adjusting the operation ids, a dialog opens up to eliminate those inconsistencies marked in purple. The transfer back to the PD cannot take place until all inconsistencies have been removed.
When transferring back the following changed data is taken along:
▪the order and assignment of the operations as well as their operation ids,
▪recalculated or detailed times (e.g. target times in the task groups),
▪changed positions or the layout.