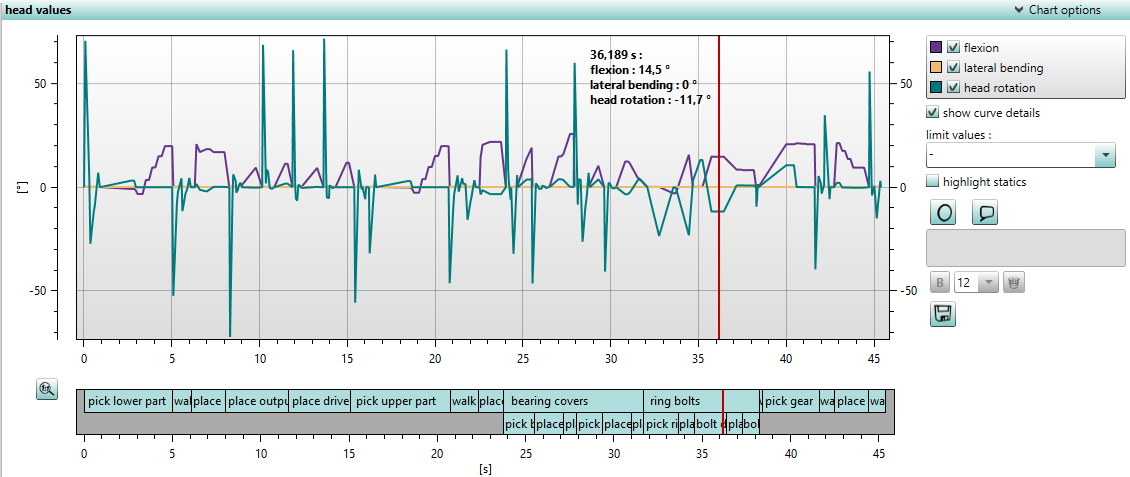
Head values are shown in the chart (figure Head values) as angles of flexion, lateral bending, and head rotation in degrees [°]. In the legend next to the chart there is the color assignment of the graph, which can be shown or hidden separately.

Figure 93: Head values
The displaying and chart options are the same as the ones described in User interface / Sub tab "Ergonomics" / Spine values.
Furthermore, the limit values of the body angles can be shown as coloring of the upper body of the human model in the simulation (see chapter User interface / 3D settings / Documentation).